Quartiles and the Interquartile Range
Expert reviewed • 08 January 2025 • 13 minute read
- identify outliers and investigate and describe the effect of outliers on summary statistics
- use different approaches for identifying outliers, for example consideration of the distance from the mean or median, or the use of below and above as criteria, recognising and justifying when each approach is appropriate
- investigate and recognise the effect of outliers on the mean, median and standard deviation
What are Quartiles?
Quartiles in the HSC mathematics advanced course are values that divide a data set into four equal parts, each representing a quarter (25%) of the data points of a sample. They are key measures in statistics that provide insight into the distribution and spread of the data. The quartiles of a dataset are defined below:
- First Quartile : Also known as the lower quartile, it is the median of the lower half of the data set. This marks the first 25% of the dataset.
- Second Quartile : This is the median of the entire data set. It marks the value located at 50% of the dataset, dividing the data into two equal halves.
- Third Quartile : Also known as the upper quartile, it is the median of the upper half of the data set. This marks the value at 75% of the dataset.
Even and Odd Datasets
When determining the quartiles of a dataset, we must first establish if the dataset has an even or odd number of values. If there is an even number or scores, we must follow the listed steps below:
- is the middle score of the whole data set. To find this, we must take the two middle values and determine the average between them.
- Separate the dataset into two lists of equal size. The first list should contain values smaller than the median of the whole dataset. The second list should contain values larger than the median of the entire dataset.
- We can then find by taking the median of the first list.
- is then found by determining the median of the second list.
To find the quartiles of a data set with an odd number of scores, we must adhere to the following steps:
- is the middle score of the whole data set.
- Omit the middle score of the data set, separating the dataset into two lists of equal size. The first list should contain values smaller than the median of the whole dataset. The second list should contain values larger than the median of the entire dataset.
- We can then find by taking the median of the first list.
- can then be found by determining the median of the second list.
Practice Question 1
Determine the quartiles of the following dataset.
Solution
As we can see from the data set, the middle score is simply as there is an odd number of scores. By omitting this value, we are given two lists on either side of the median.
To find we must find the median of the list . From this, we see that the value is .
To find we must find the median of the list . From this, we see that the value is .
What is the Interquartile Range?
The interquartile range or measures the spread of the middle 50% of the data. Determining the is useful, as it is less affected by outliers than the range. It is calculated as the difference between the third and first quartiles.
Using Quartiles to Determine Outliers
Outliers are data points that significantly differ from other observations in a dataset. They are unusual values that can be much higher or lower than the rest of the data. We can determine outliers using the quartiles. A score of a dataset is considered an outlier when the following occurs:
Practice Question 2
Determine any outliers contained in the following data set. The quartiles of the data set are as follows: , ,
Solution
Before we find an outliers, we must first determine the interquartile range.
To find any outliers in the lower part of the data set, we must use the formula given above to determine the lower bound.
As there are no values less than in the dataset, there are no outliers in the bottom half of the dataset.
To find any outliers in the part of the data set with larger values, we must use the formula given above to determine the upper bound.
As we can see in the dataset, there are two scores larger than a value of . Thus, the scores of and are outliers.
Box and Whisker Plots
A box and whisker plot is a graphical representation used to display the distribution of a data set. It provides a visual summary of the quartiles of a dataset, highlighting the median, spread, and potential outliers. A box and whisker plot looks like the following:
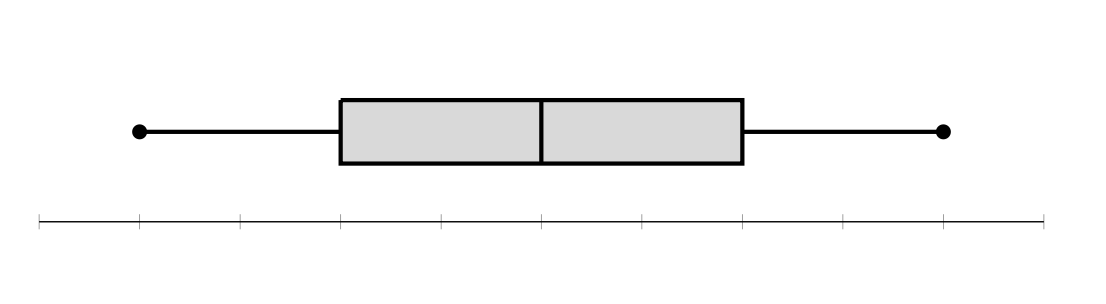
As seen in the graph, the box represents the scores that lie within the interquartile range. The lines within the box represent the quartiles of the data. The left edge of the box is the first quartile . The middle line of the box is the second quartile . The right edge of the box is the third quartile . The whiskers (the lines leading to the dots) indicate the range in which points of the data set are not considered outliers. The lower whisker extends to the smallest data point within 1.5 times the interquartile range below the first quartile. The upper whisker extends to the largest data point within 1.5 times the interquartile range above the third quartile. Any points located outside the whiskers are generally considered outliers.