Regions of a Plane
Expert reviewed • 04 March 2025 • 6 minute read
HSC Maths Advanced Syllabus
- use graphical methods with supporting algebraic working to solve a variety of practical problems involving any of the functions within the scope of this syllabus, in both real-life and abstract contexts
- determine the number of solutions of an equation by considering appropriate graphs
- solve linear and quadratic inequalities by sketching appropriate graphs
Note:
Video coming soon!
What are Regions of a Plane
The concept of a plane's regions refers to the separation of a cartesian plane according the specific criteria. Most often, regions are defined by inequalities, lines or curves, with the solution depicted by shading a certain area.
The boundary created by a curve splits regions apart, and is determined by the inequality symbol. As such, by using the boundary and drawing the curve, the solution which satisfies the inequality can be shaded.
Now it is important to know that when drawing the curve as a boundary line, if the inequality is defined by either , the curve should be drawn as a solid line. However, if the inequality is defined by either , the curve should be drawn as a dotted line.
Additionally, an area that is being shaded between two different curves, rather than a curve and an axis, will also be affected by the inequality symbol. The intersection between curves must be addressed and defined by either an open or closed circle, to display if the point of intersection is included or not. This can be done by either inspection or substituting points into both inequalities, to see if they satisfy the required limits.
Note: an open dot/circle (white) represents that a point is included, while a closed dot/circle (black) demonstrates that a point is not included.
Practice Question 1
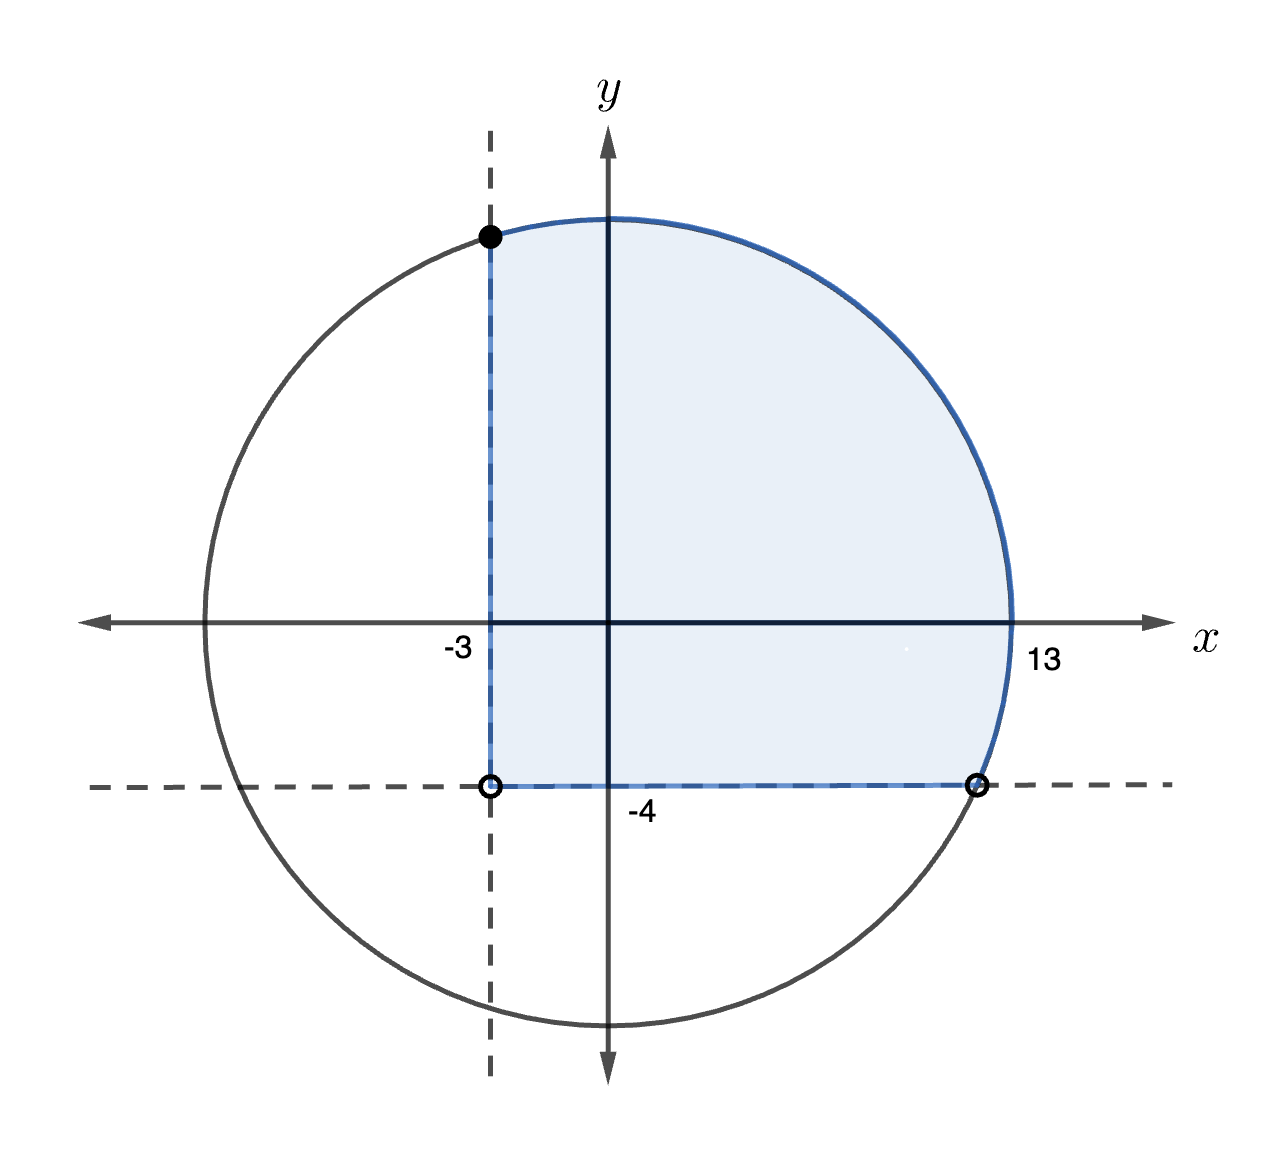
Graph the region of the function , where and
Solution
Our first step is to sketch this graph. From the form this is in, we can see that the function will create a circle, with centre at the origin and a radius of .
On the same graph, we construct lines for both and . Now from the limits, we can see that a solid dot must be included where line meets the function. Additionally, where the line meets both the function and the line we must use an open/white dot to indicate they are not within the limit.
Finally we must shade the area of the graph, according to the inequation, which will cause it to look like the following: