Protection Graphs
Expert reviewed • 04 March 2025 • 4 minute read
Tariff Diagram
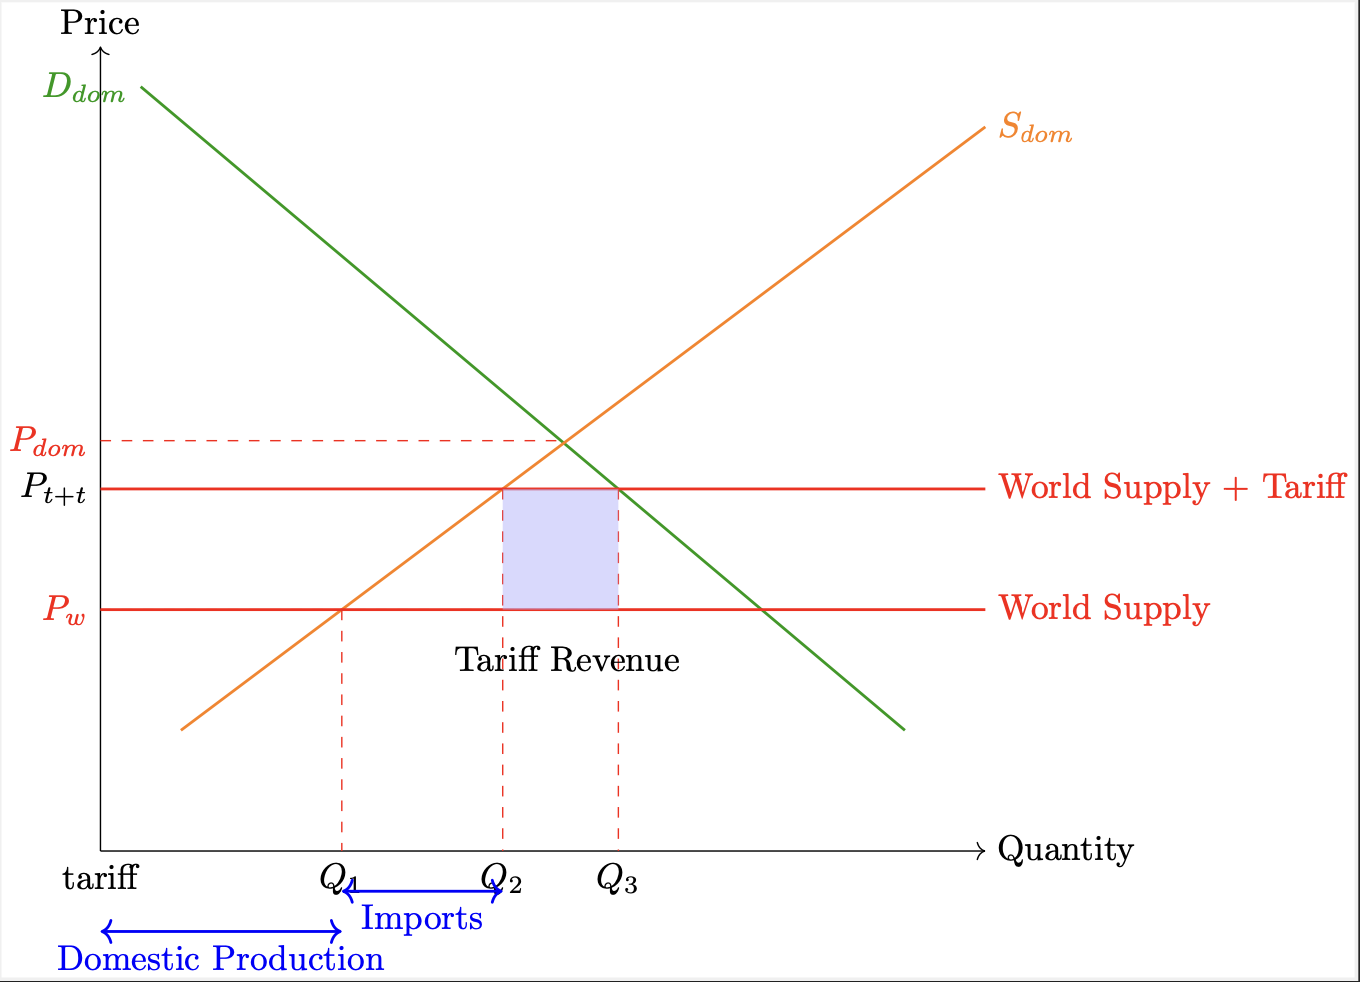
The implementation of a tariff raises the price from to . At this higher price, domestic production increases from to as more local producers can supply the good profitably. Simultaneously, the quantity demanded by consumers falls from to due to the higher price. This reduces imports from to . The government collects tariff revenue, represented by the shaded rectangle, equal to . This revenue is essentially a transfer from consumers to the government. The tariff results in increased domestic production, decreased consumption, reduced imports, and generates government revenue, but also leads to higher prices for consumers.
Import Quota Diagram

The implementation of an import quota restricts imports to . This creates scarcity in the market, leading to excess demand. As a result, the domestic price rises from to . The quota effectively shifts the supply curve to . The quota thus achieves its goal of limiting imports and supporting domestic producers, but at the cost of higher prices for consumers and reduced overall consumption.