The Cash Rate Graph
Expert reviewed • 04 March 2025 • 4 minute read
What is the Purpose of the Cash Rate Target Graph?
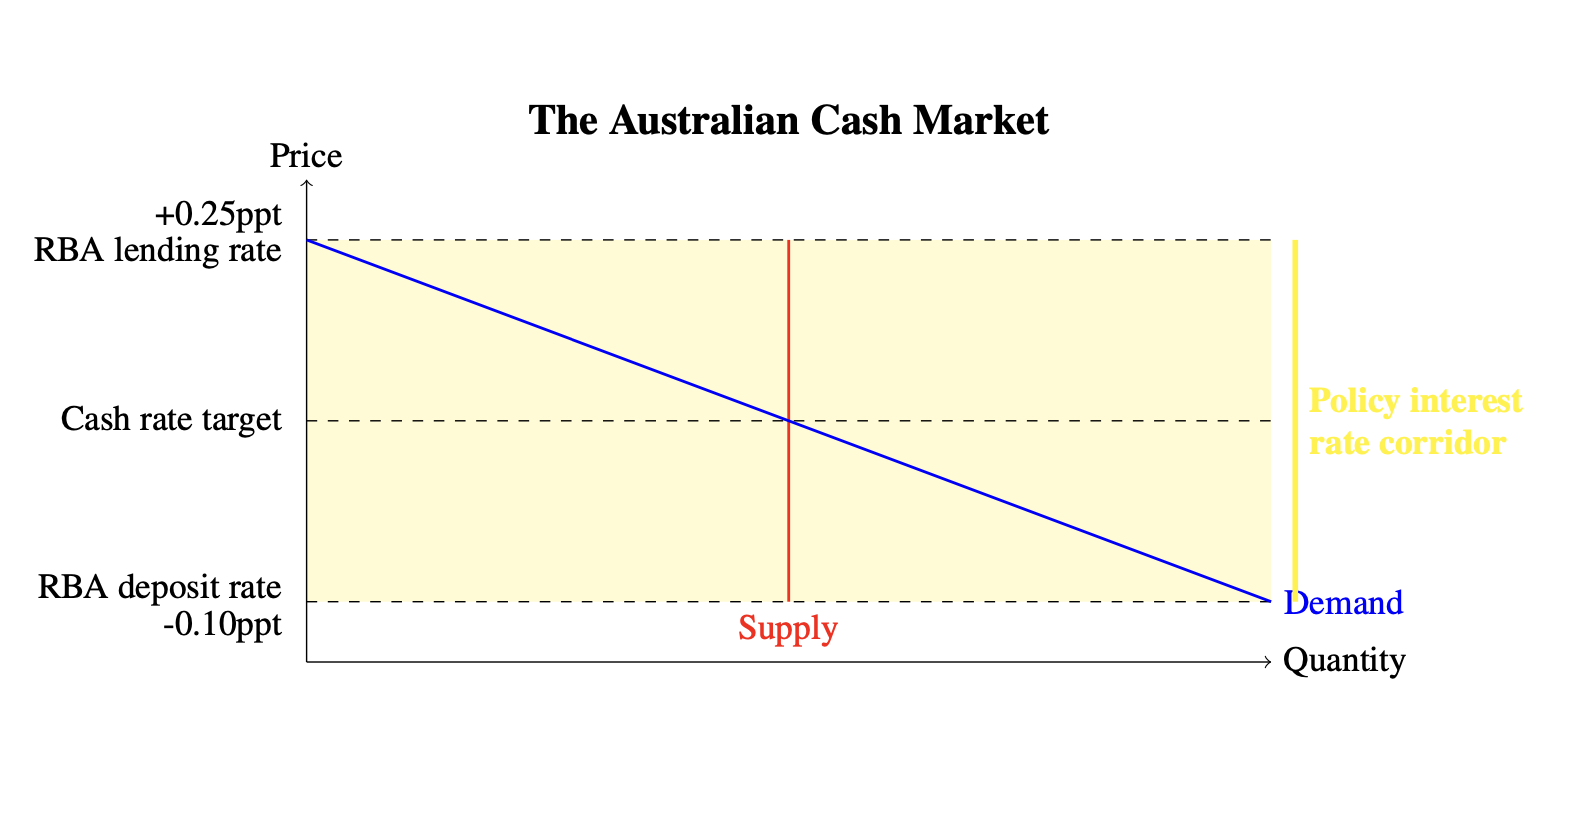
The cash rate target graph in Australia illustrates the Reserve Bank of Australia's (RBA) target for the cash rate, which is the overnight interest rate at which banks lend to each other. The graph tracks changes in the cash rate target over time and provides insights into the RBA's monetary policy stance. The following graph displays that the target rate set by the RBA sits in a corridor: the floor rate sits below the target rate, and the ceiling sits above the target rate.
Key Points of the Cash Rate Target Graph
- Cash Rate:
- The cash rate is the benchmark interest rate in the Australian financial system.
- It influences other interest rates, including those for mortgages, savings, and loans, impacting overall economic activity.
- Graph Representation:
- The vertical axis represents the cash rate percentage.
- The horizontal axis represents time, typically in months or years.
- Each point on the graph indicates the cash rate target set by the RBA at a specific point in time.
RBA's Use of Monetary Policy
The Reserve Bank of Australia (RBA) uses monetary policy to achieve its primary objectives, which are to ensure stability in the Australian dollar, maintain full employment, and promote economic prosperity and welfare for the Australian people. The main tool for conducting monetary policy is the adjustment of the cash rate target. The use of this graph in explaining how monetary policy works is explained in the chapter on Australia's Monetary Policy. Additionally, to find specific examples using the cash rate graph in a monetary policy essay, visit our premium resources.