Rates and Differentiation
Expert reviewed • 04 March 2025 • 8 minute read
HSC Maths Advanced Syllabus
- define and interpret the concept of the second derivative as the rate of change of the first
derivative function in a variety of contexts, for example recognise acceleration as the second
derivative of displacement with respect to time
- understand the concepts of concavity and points of inflection and their relationship with the second derivative
- use the second derivative to determine concavity and the nature of stationary points
- understand that when the second derivative is equal to 0 this does not necessarily represent a point of inflection
- define variables and construct functions to represent the relationships between variables related to contexts involving optimisation, sketching diagrams or completing diagrams if necessary
Note:
Video coming soon!
Increasing or Decreasing?
A chord on a graph generally refers to a straight line segment whose endpoints lie on the curve of the function. As such, we define a chord by its start and end points, defined as points and , creating an interval . Thus, we can determine if a function is increasing or decreasing, depending on the slope of the chord that connects the interval.
For a function , we can consider the following:
The function is called increasing if the following condition is met:
Where . This means that the chord slopes upward.
The function is called decreasing if the following condition is met:
Where . This means that the chord slopes downward.
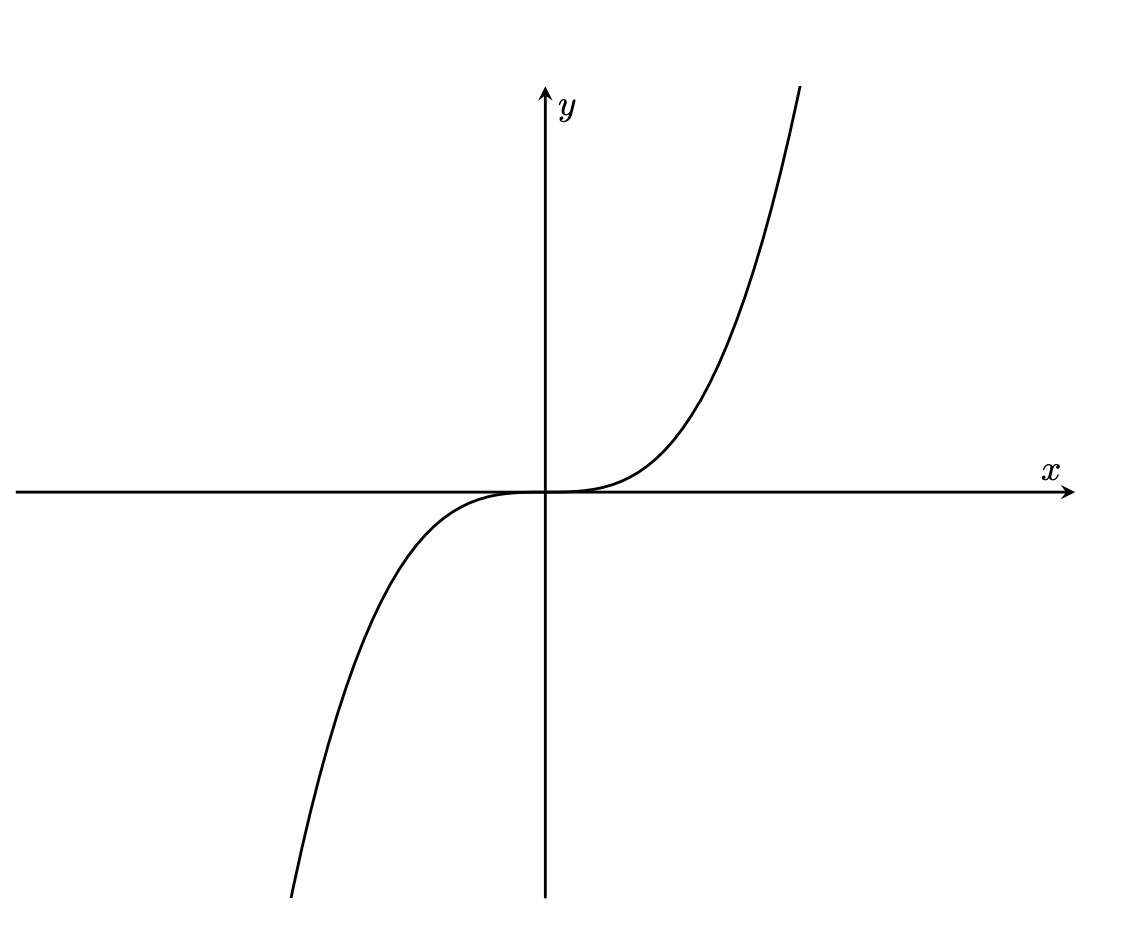
For example, we can see the following graph is increasing, because if we were to connect the start and end points, the chord would slope upward.
Concavity Within the Interval
We can also use the chord to determine the function's concavity. By drawing a chord that connects points and , which make up an interval , the function's concavity can be found.
- If the chord lies above the curve of the function, the function is considered concave up within the interval
- If the chord lies below the curve of the function, the function is considered concave down within the interval
Determining the Rate of a Curve
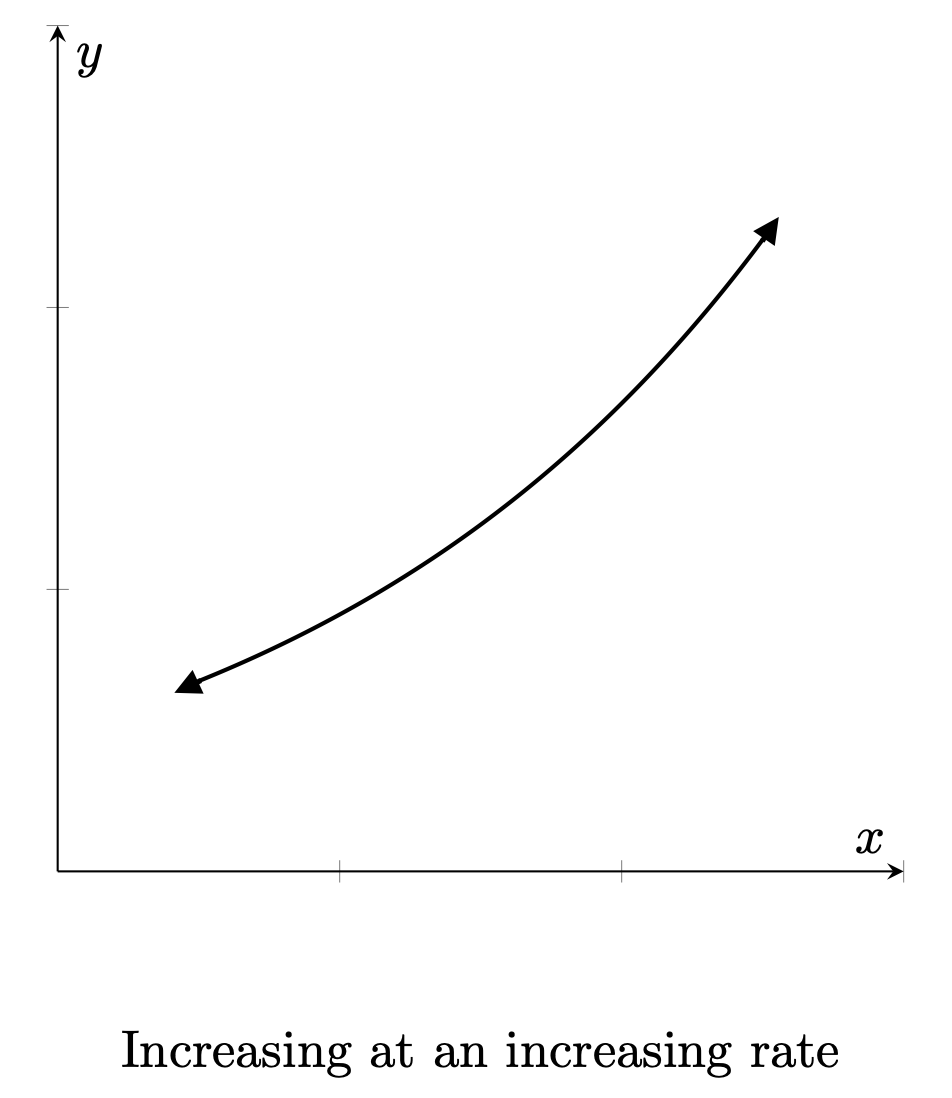
A function that is increasing at an increasing rate, is increasing and concave up.
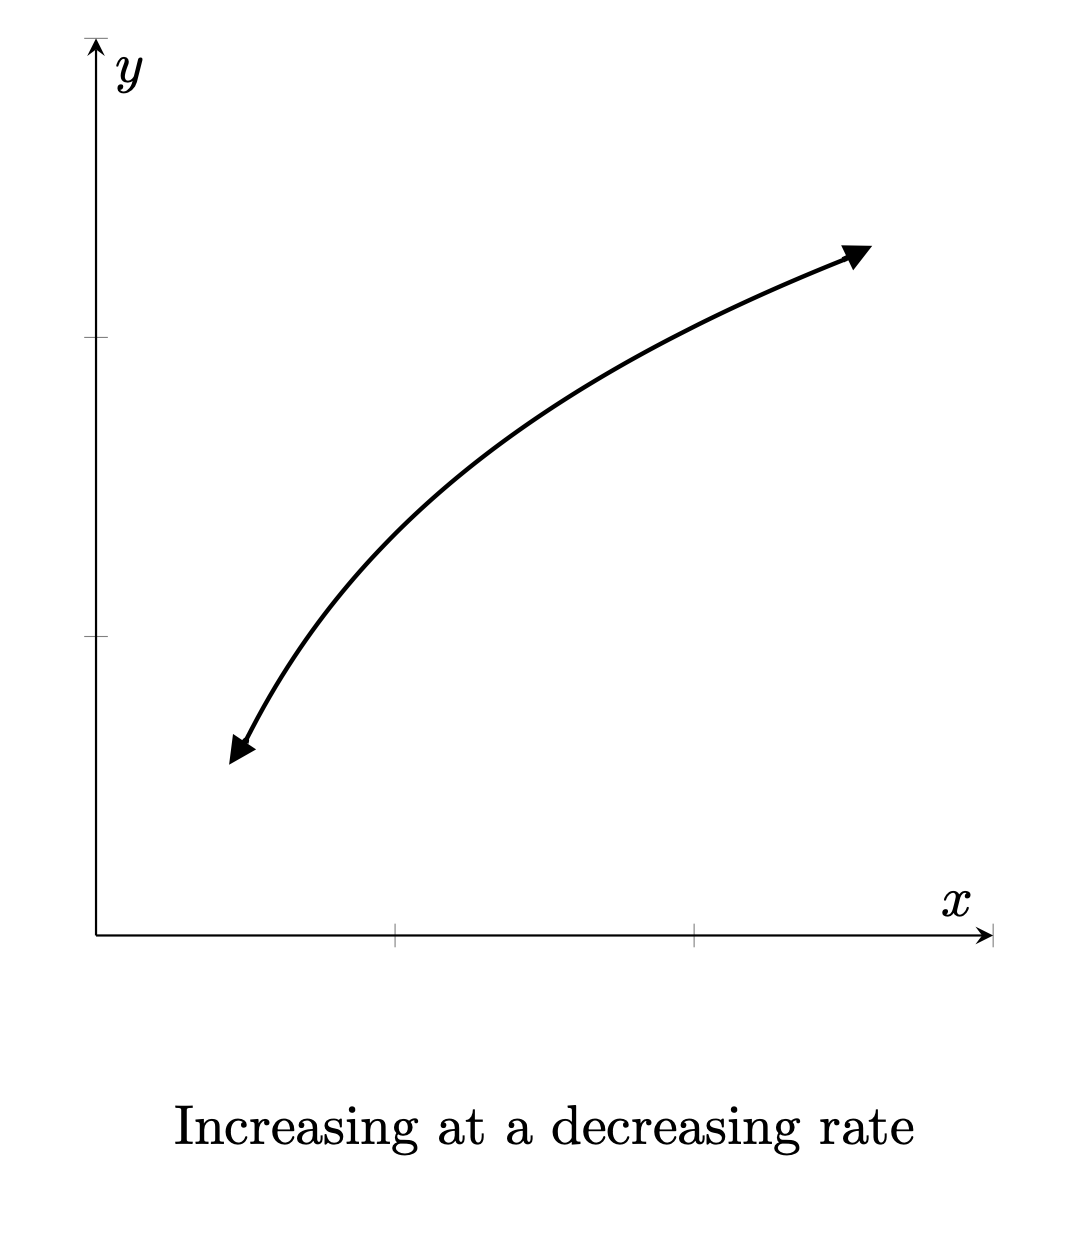
A function that is increasing at a decreasing rate, is increasing but the curve is concave down
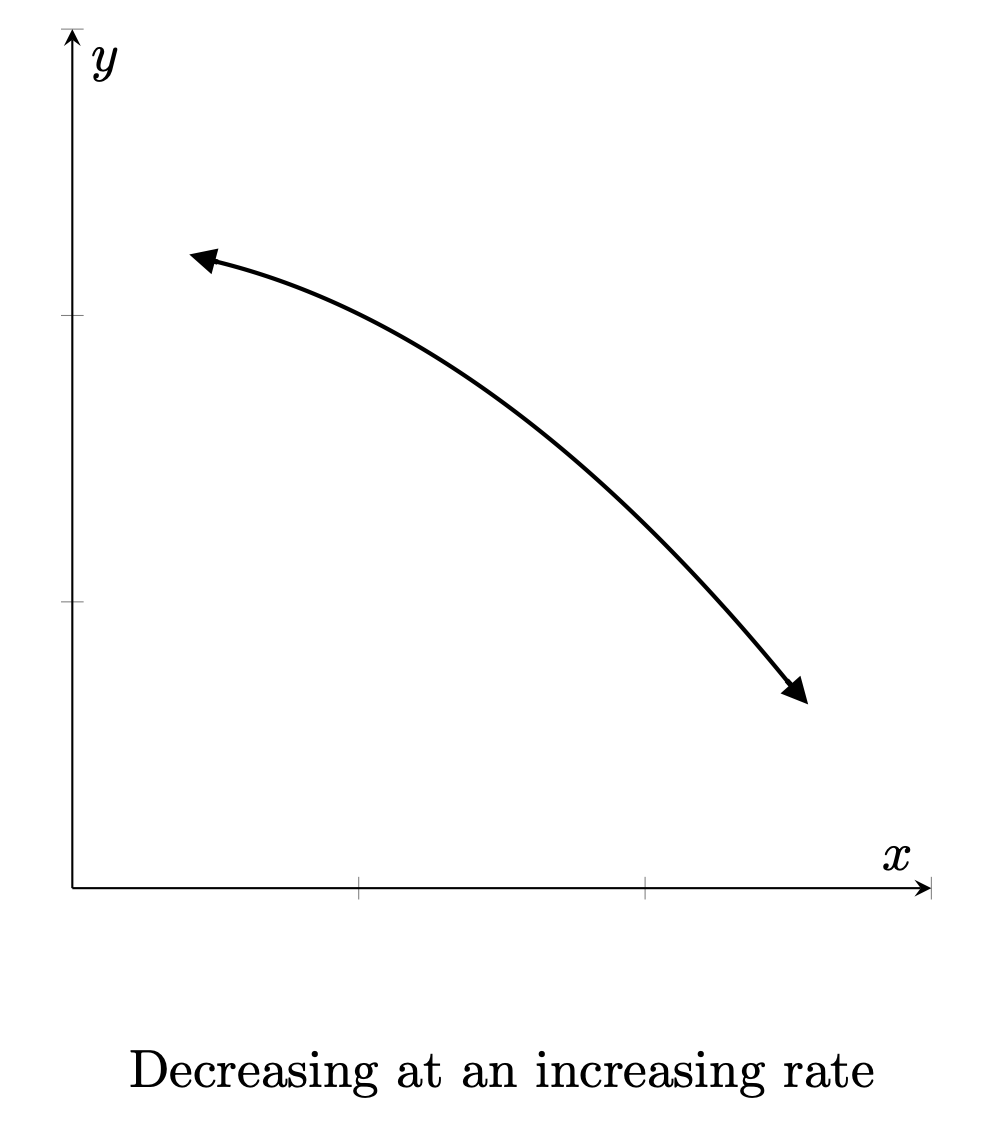
A function that is decreasing at an increasing rate, is decreasing and is concave down
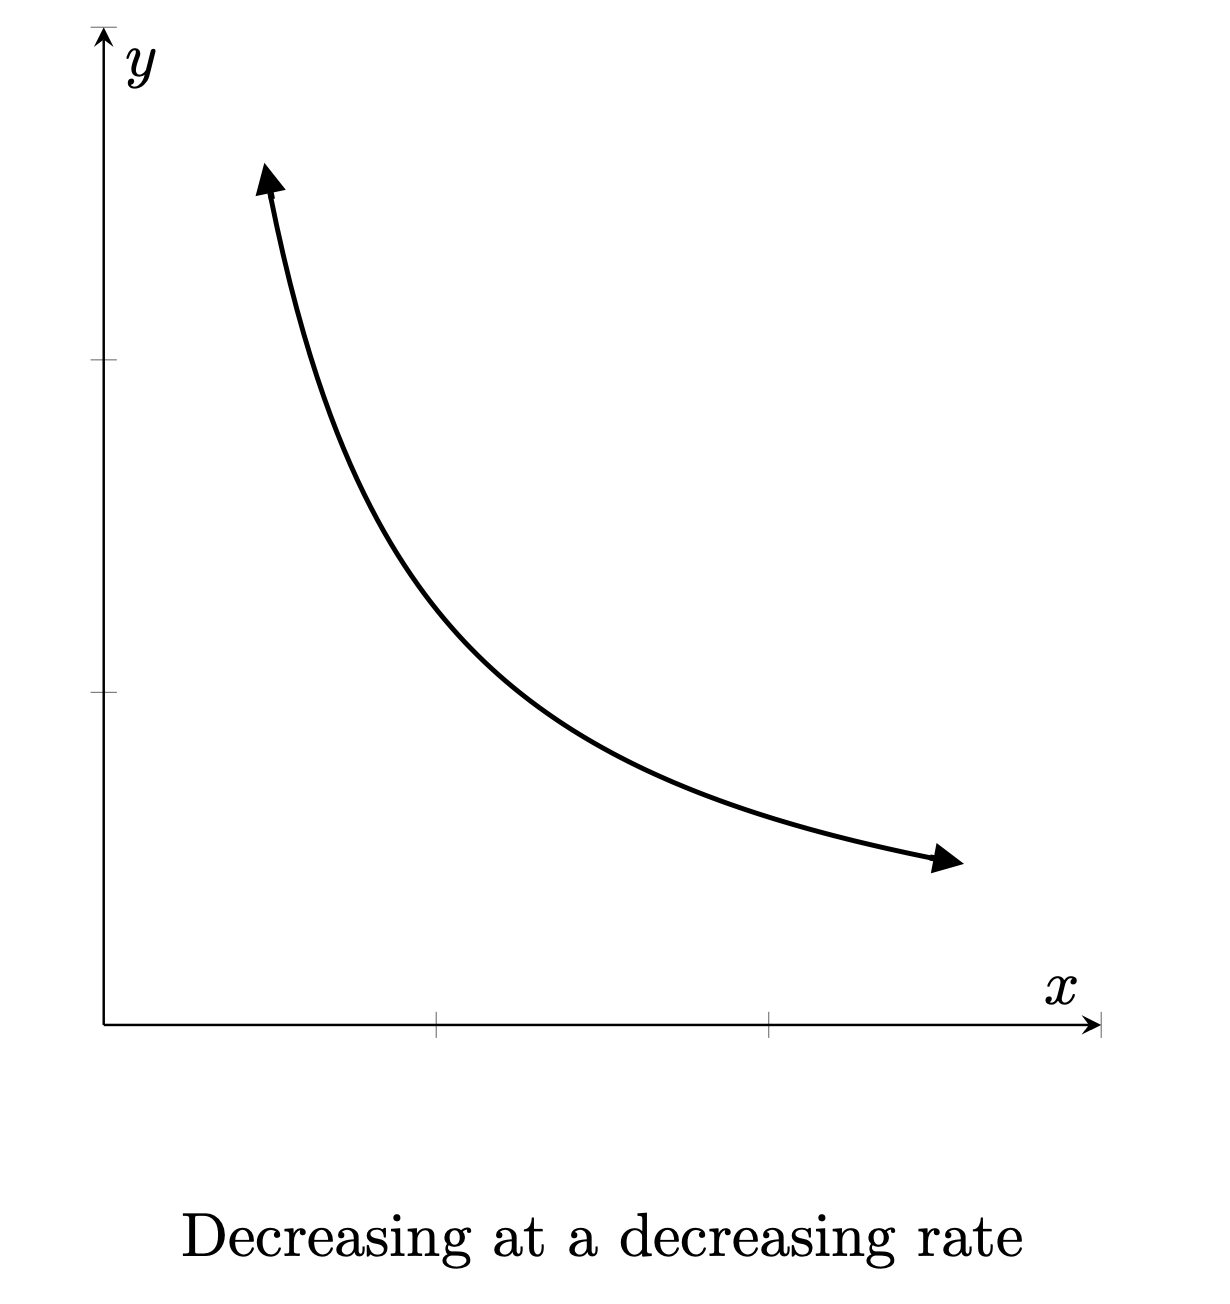
A function is decreasing at a decreasing rate, is decreasing but it is concave up.
Practice Question 1
For the first 12 months after its first listing, the share price in cents of the company "JMJ Technology" followed the cubic function: , where is in months after listing. Calculate the share price at the initial listing and at the end of the 12 months.
Solution
First we must find the initial share price at listing (this is when ):
Now we must find the share price at the end of the 12 months (
Practice Question 2
Using the information provided in the previous question, determine the rate of change of the price at .
Solution
To determine the rate of change in price at we must derive and substitute given values: