The Production Possibility Curve
Expert reviewed • 04 March 2025 • 4 minute read
What is the Purpose of Using the Production Possibility Curve (PPC) in Economics?
The Production Possibility Curve (PPC), also known as the Production Possibility Frontier (PPF), is a fundamental concept in economics used to illustrate the trade-offs and opportunity costs associated with the allocation of resources. The PPC demonstrates the maximum possible output combinations of two goods or services that an economy can achieve when all resources are fully and efficiently utilised.
Key Components of the PPC
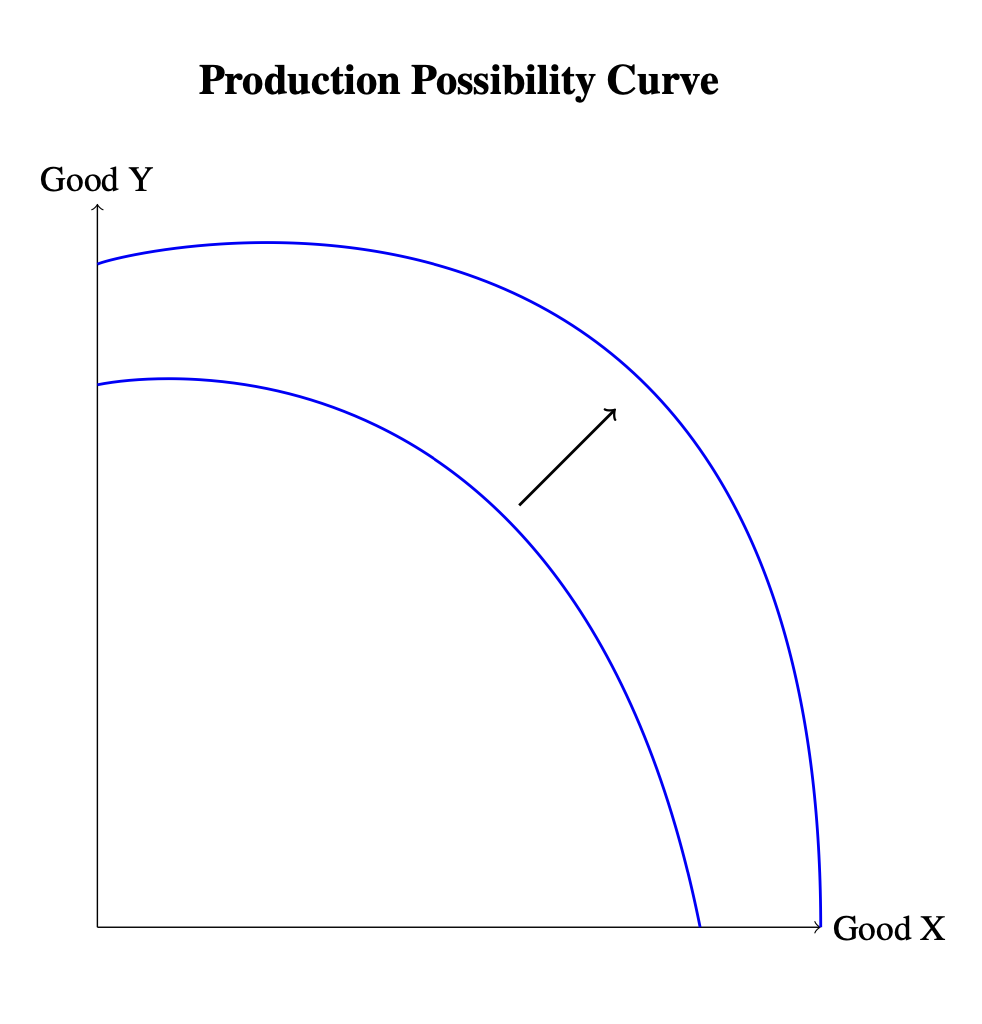
As we can see from the graph shown above, the PPC shows that resources are limited, and producing more of one good or service requires producing less of another. This illustrates the concept of scarcity and the trade-offs that must be made in resource allocation. The PPC thus demonstrates the following trends:
- Demonstrating Opportunity Cost:
- The PPC helps to visualise opportunity cost, which is the value of the next best alternative foregone when a choice is made. The slope of the PPC indicates the rate at which one good must be sacrificed to produce more of another good.
- Efficiency:
- Points on the PPC represent efficient production levels where resources are fully utilised. Any point inside the curve indicates inefficiency, as resources are not being used to their full potential.
- Points outside the curve are unattainable with current resources and technology.
- Economic Growth:
- The PPC can shift outward with economic growth, which occurs due to factors such as technological advancements, an increase in resource availability, or improvements in labour productivity. An outward shift indicates that an economy can produce more of both goods.
- Resource Allocation:
- The PPC helps in understanding how resources can be allocated between different goods to achieve the best possible production outcomes. It shows the potential production levels and helps in planning and decision-making.