Measuring the Distribution of Income and Wealth
Expert reviewed • 04 March 2025 • 7 minute read
What is the Distribution of Income and Wealth?
The distribution of income and wealth is a critical issue in economics, as it reflects how evenly or unevenly resources are shared among a population. Understanding and measuring these distributions are essential for policymakers to address inequality and promote economic justice. There are two primary methods for measuring the distribution of income and wealth: the Lorenz Curve and the Gini Coefficient.
What is the Lorenz Curve?
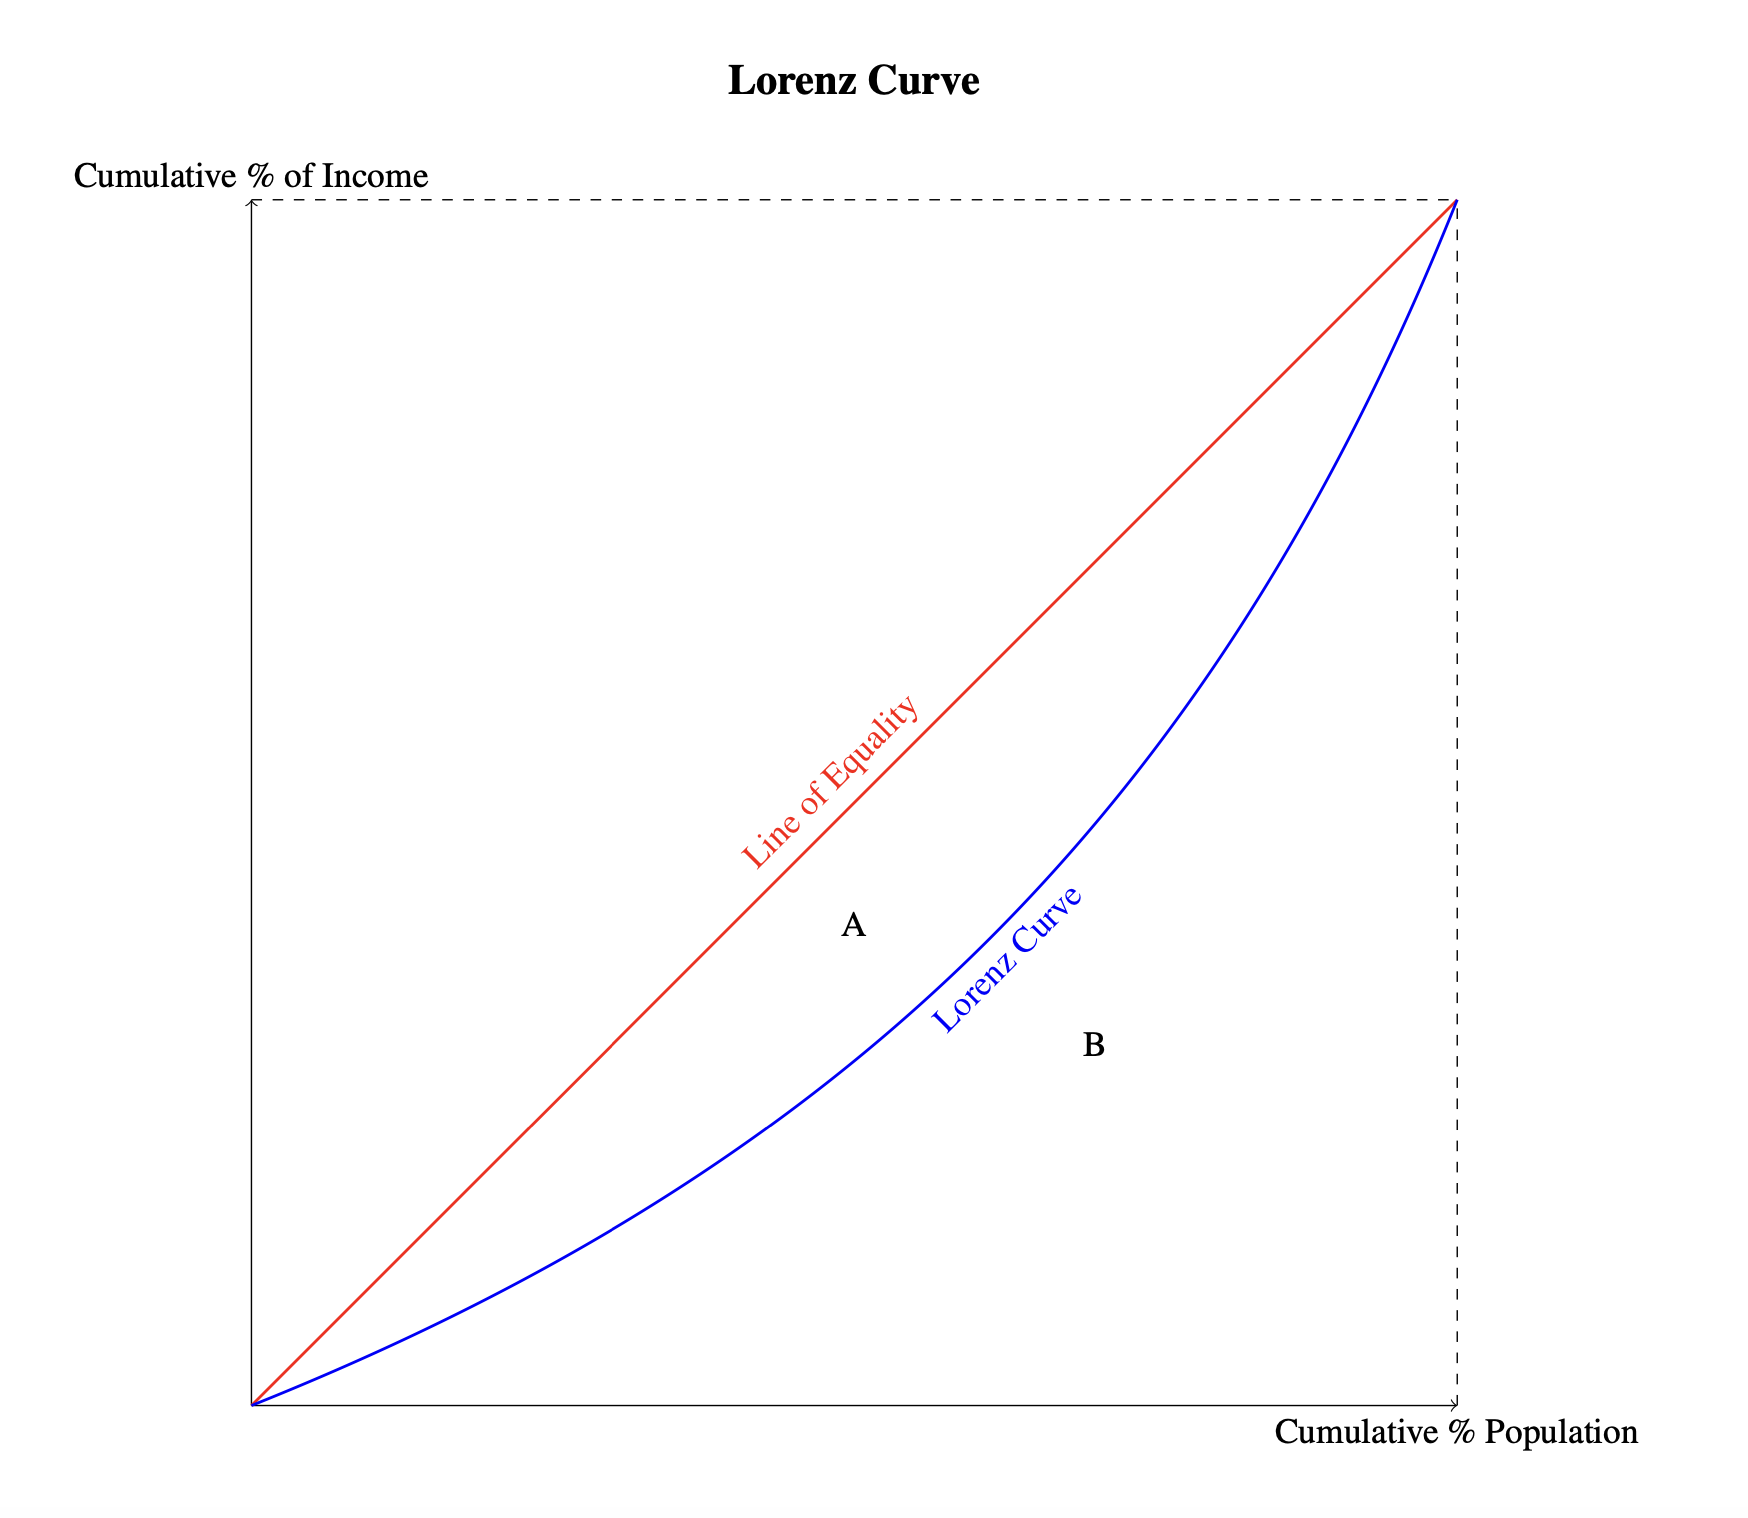
The Lorenz Curve is a graphical representation of income or wealth distribution across a population. It plots the cumulative percentage of total income or wealth against the cumulative percentage of households, starting with the poorest. More about the Lorenz curve's shape and how you can integrate it into your economic essays can be found in our Lorenz curve graphing module.
In a perfectly equal distribution, the Lorenz Curve would be a 45-degree line from the origin to the top right corner, known as the line of equality. The more the Lorenz Curve bows away from this line, the greater the level of inequality.
Consider a hypothetical economy where the poorest 20% of households earn 5% of the total income, the next 20% earn 10%, and so on. The Lorenz Curve for this distribution would bow significantly away from the line of equality, indicating high inequality.
Advantages:
The advantages of using the Lorenz curve as a measure of the distribution of income and wealth are:
- Provides a visual representation of inequality
- Allows for easy comparison between different time periods or countries
Limitations:
The limitations of using the Lorenz curve as a measure of the distribution of income and wealth are:
- Does not provide a single numerical measure of inequality
- Can be complex to construct with large datasets and under time pressure in examinations
What is the Gini Coefficient?
The Gini Coefficient is a numerical measure of income or wealth inequality based on the Lorenz Curve. It ranges from 0 to 1, where:
- 0 represents perfect equality (everyone has the same income or wealth).
- 1 represents perfect inequality (one person has all the income or wealth, and everyone else has none).
Gini Coefficient Formula:
The formula for calculating the Gini Coefficient, using the Lorenz curve, is as follows:
Where,
- Area between the Lorenz Curve and the line of perfect equality
- Area under the Lorenz Curve
(see Lorenz curve below)
Advantages:
The advantages of using the Gini Coefficient as a measure of the distribution of income and wealth are:
- Provides a single, comparable measure of inequality
- Widely used and understood internationally
Limitations:
The limitations of using the Gini Coefficient as a measure of the distribution of income and wealth are:
- Does not show where in the distribution inequality occurs
- Can be sensitive to changes in the middle of the distribution