Measuring Inflation
Expert reviewed • 04 March 2025 • 12 minute read
How do you Measure Inflation?
Inflation is a critical economic indicator that measures the rate at which the general level of prices for goods and services rises, leading to a decrease in purchasing power. Understanding how to measure inflation is essential for economists, policymakers, and businesses to make informed decisions. Generally, inflation is measured under two categories: headline and underlying inflation.
What is Headline Inflation?
Headline inflation is the most commonly cited measure of inflation. It refers to the total inflation within an economy, including all goods and services in the consumer basket. It is measured by the Consumer Price Index (CPI), which tracks changes in the prices of a fixed basket of goods and services over time.
Consumer Price Index (CPI)
The CPI is the primary tool for measuring headline inflation in Australia. It is calculated by taking price changes for each item in the predetermined basket of goods and averaging them. Goods and services are weighted according to their importance. For example, in Australia, the Australian Bureau of Statistics (ABS) calculates the CPI. As of June 2023, the annual CPI inflation rate was 6.8%, indicating a general increase in prices. This had dropped to 4% as of May 2024.
Furthermore, the method of calculating CPI is as follows:
- Basket of goods is measured: The ABS selects a representative basket of goods and services commonly purchased by households.
- Weighting: Each item in the basket is assigned a weight based on its importance in the average household budget.
- Price collection: Prices for these items are collected regularly (usually quarterly in Australia).
- Index calculation: The weighted average price change is calculated to produce the CPI.
The CPI basket includes categories such as food, housing, transportation, healthcare, and education. Changes in the prices of these categories reflect the overall movement in inflation.
The CPI Formula:
The formula to calculate the CPI is as follows:
Additionally, the headline inflation rate is calculated using the following formula:
Advantages of Headline Inflation:
Headline inflation offers several key advantages as an economic indicator. It provides a measure of price changes across the entire economy, capturing a broad range of goods and services. This makes it easily understood by the general public, who can relate to the overall impact on their daily lives. Additionally, headline inflation is often used for indexing wages and government payments, ensuring that incomes and benefits keep pace with the changing cost of living.
Limitations of Headline Inflation:
However headline inflation, while useful, has some notable limitations. It can be volatile due to temporary price shocks, such as sudden changes in oil prices, which may not reflect long-term economic trends. Furthermore, it may not accurately represent the cost of living for all demographic groups, as spending patterns can vary significantly across different segments of the population.
What is Underlying Inflation?
Underlying inflation, also known as core inflation, is different from headline inflation as it excludes volatile items such as food and energy prices. This is done to provide a more stable measure of inflation. It is useful for policymakers to identify persistent trends in inflation and make decisions accordingly. As part of underlying inflation, there are two main methods of measurement. These are trimmed mean and weighted median.
- The Trimmed Mean, excludes the most volatile items (15% from each end of the distribution of price changes).
- The Weighted Median calculates the price change at the 50th percentile by weight in the distribution of price changes.
Trimmed Mean:
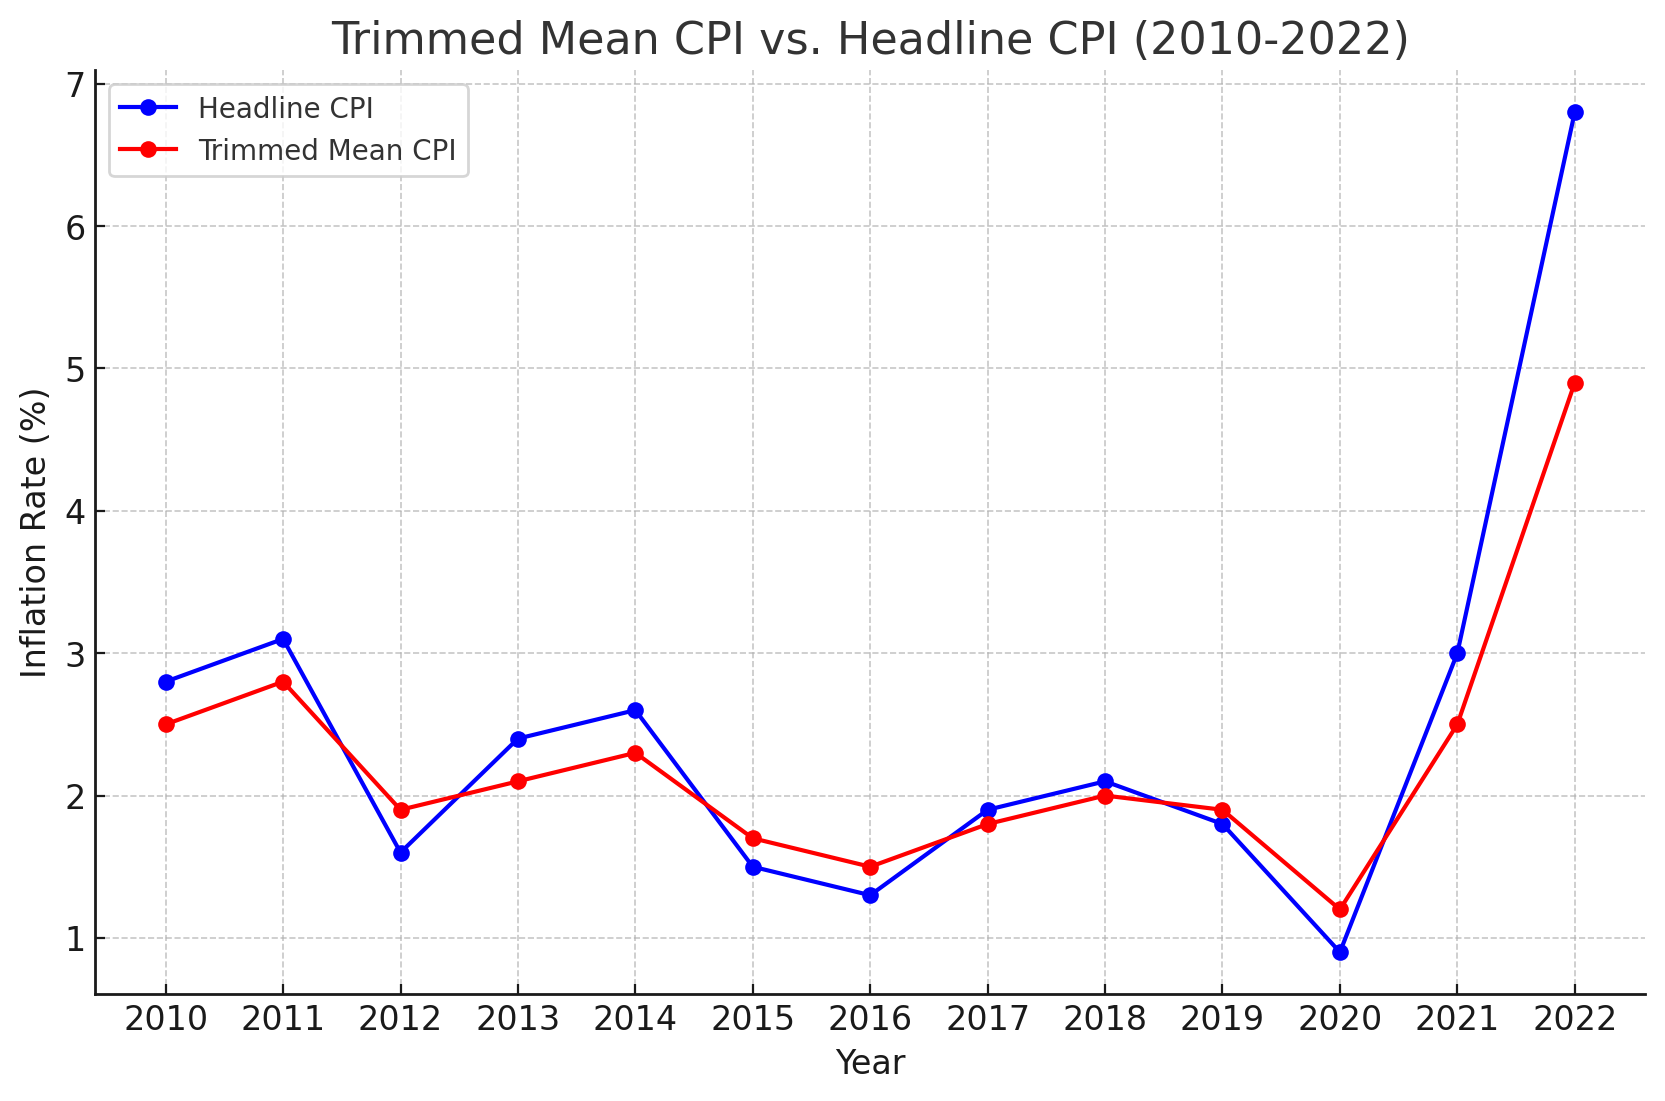
The Trimmed Mean CPI method, removes the most volatile items in the CPI basket and calculates the average of the remaining items. It provides a clearer picture of the persistent price changes. For example, The Reserve Bank of Australia (RBA) uses the trimmed mean CPI to assess underlying inflation. For the year ending June 2023, the trimmed mean CPI in Australia was 4.9%, indicating more stable inflation compared to the headline rate.
Furthermore, the trimmed mean is calculated by using the following steps:
- Arrange all CPI components by their price changes.
- Remove the bottom 15% and top 15% of items by weight.
- Calculate the weighted average of the remaining items.
By removing the most volatile items, we see that trimmed mean inflation, is less erratic and a more stable measurement than headline inflation. The following graph displays this, with the trimmed mean staying in a smaller range.
Weighted Median:
The Weighted Median CPI method considers the price change of the median item in the CPI basket, effectively filtering out extreme changes at both ends of the spectrum. It is calculated using the following steps:
- Arrange all CPI components by their price changes.
- Identify the item at the 50th percentile by cumulative weight.
What are the Advantages of Underlying Inflation?
Underlying inflation provides a clearer picture of persistent inflationary trends by excluding volatile components, making it less susceptible to temporary price shocks. This stability makes it particularly useful for guiding monetary policy decisions. Central banks rely heavily on underlying inflation measures when setting policy, as it allows them to focus on long-term price stability without overreacting to short-term fluctuations.
What are the Limitations of Underlying Inflation?
Underlying inflation may exclude significant price changes that directly impact household budgets, potentially overlooking important economic pressures felt by consumers. Additionally, different measures of underlying inflation can sometimes provide conflicting signals. Finally, the concept of underlying inflation is often less intuitive for the general public compared to headline inflation, making it more challenging to communicate economic conditions to non-experts.