Gross World Product
Expert reviewed • 04 March 2025 • 5 minute read
What is Gross World Product (GWP)?
Before studying the global economy in depth, we must first understand important metrics such as Gross World Product (GWP). GWP is the combined gross national income of all countries across the world. It is essentially the global equivalent of a country's Gross Domestic Product (GDP). This economic indicator of the size and health of the global economy, allows economists to assess trends and complete economic comparisons between regions.
How do you Calculate GWP?
GWP is calculated by summing up the Gross Domestic Product (GDP) of all countries, adjusted for exchange rates and inflation.
As of 2022, the gross world product was approximately $100 trillion (US), with the projection for 2023 to be $105 trillion and 2024 to be around $110 trillion. If you wish to see further projections for the GWP in future years, the following website has modelled a graph. GWP Projections
The Composition of GWP
The composition of GWP varies across regions and countries, reflecting differences in economic structure, resources, and development levels.
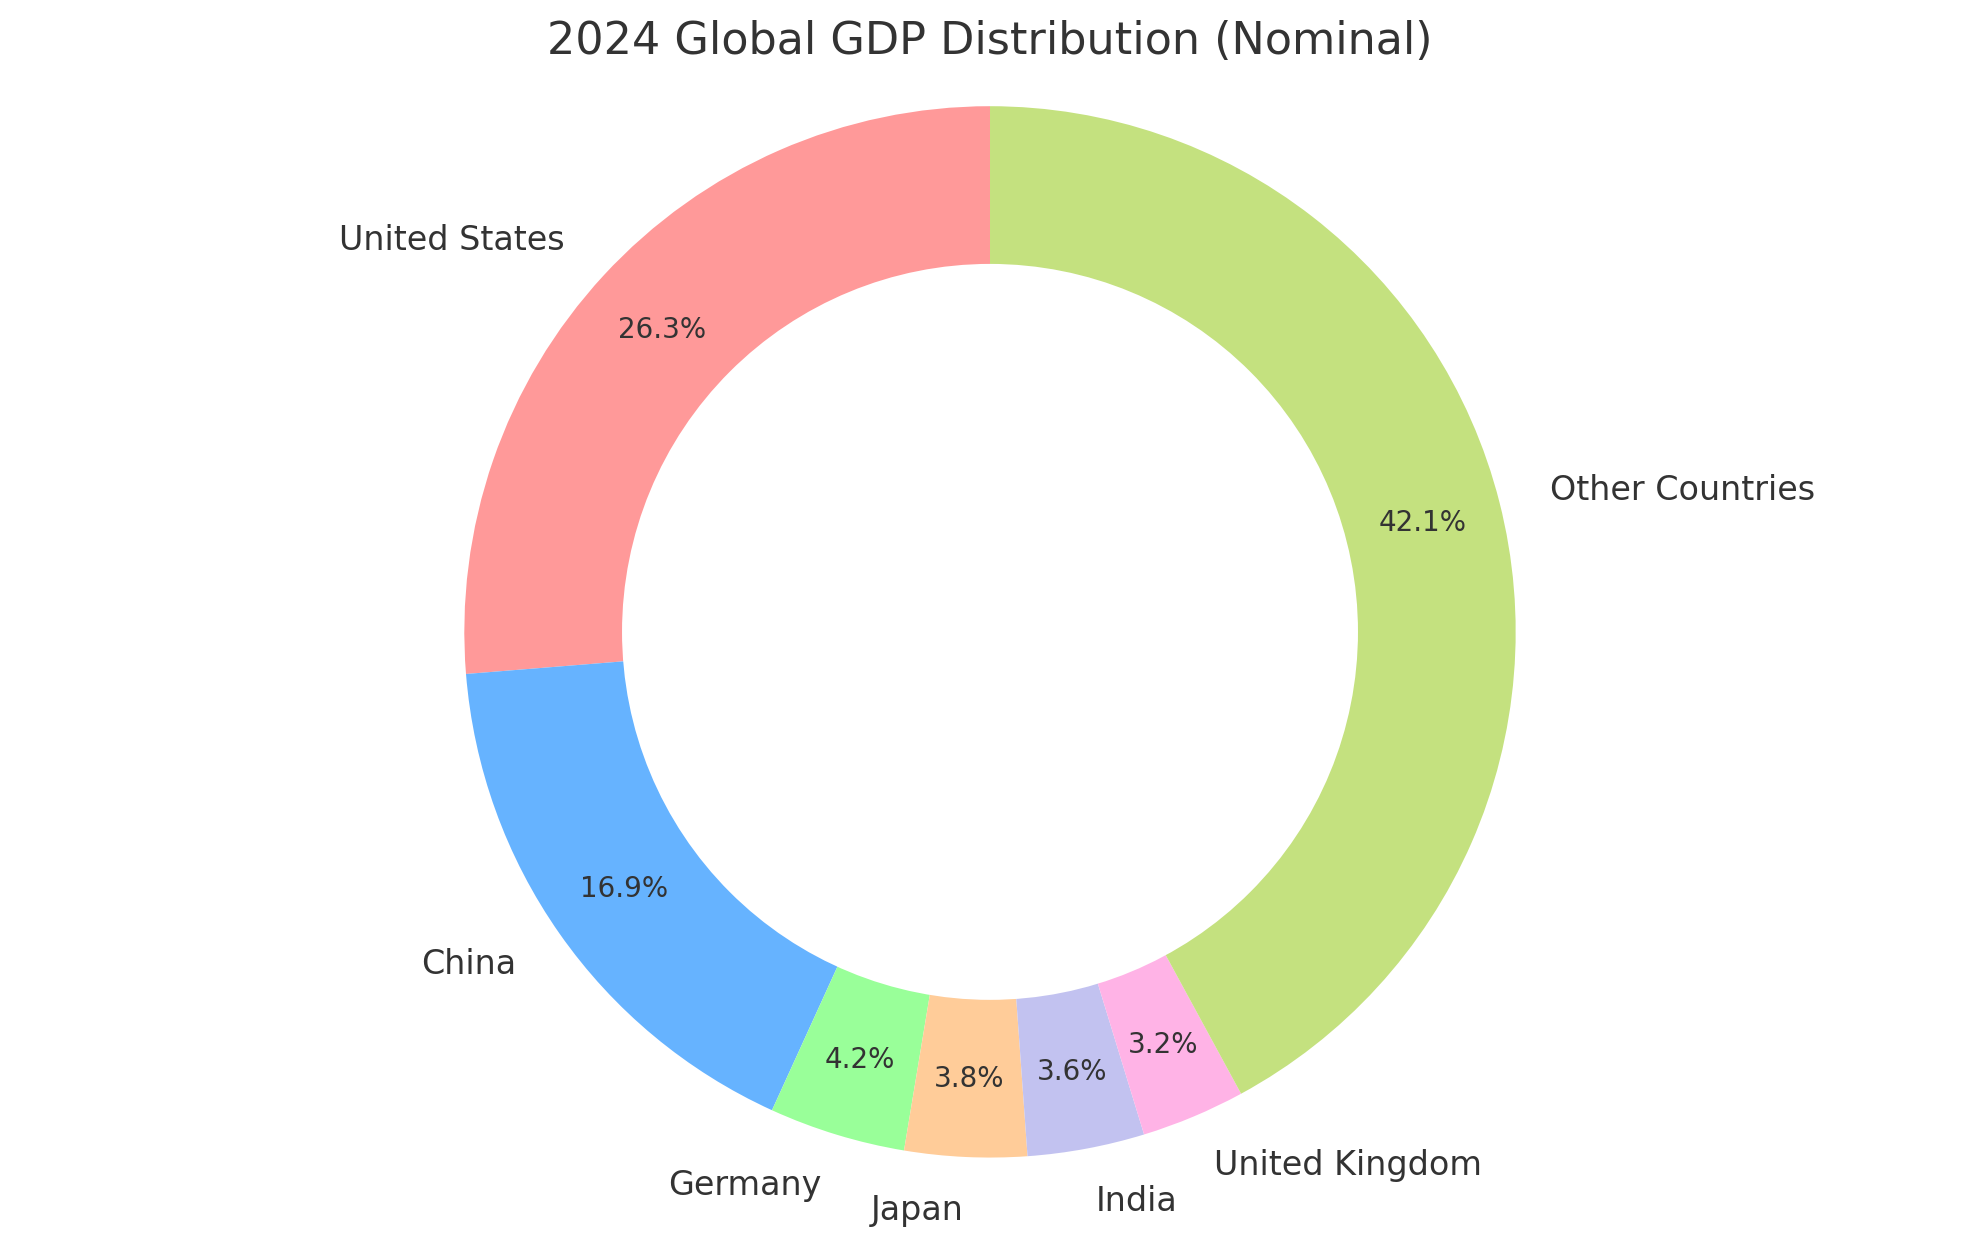
In 2022, the United States had the largest share of GWP at 25.32%, followed by China at 17.86% and Japan at 4.21%. If you wish to see the most current statistics, they are currently unavailable for 2024. However, economists across the world have analysed previous trends and created projections to display an estimate of the world's GWP for future years. The following pie chart displays the composition of GWP of the projected 2024 value.
The Sectors of GWP
The Gross World Product is comprised of various sectors, including agriculture, manufacturing, and services. In recent decades, we have seen a trend of movement toward the service sector, which accounts for the largest share of GWP in most countries.
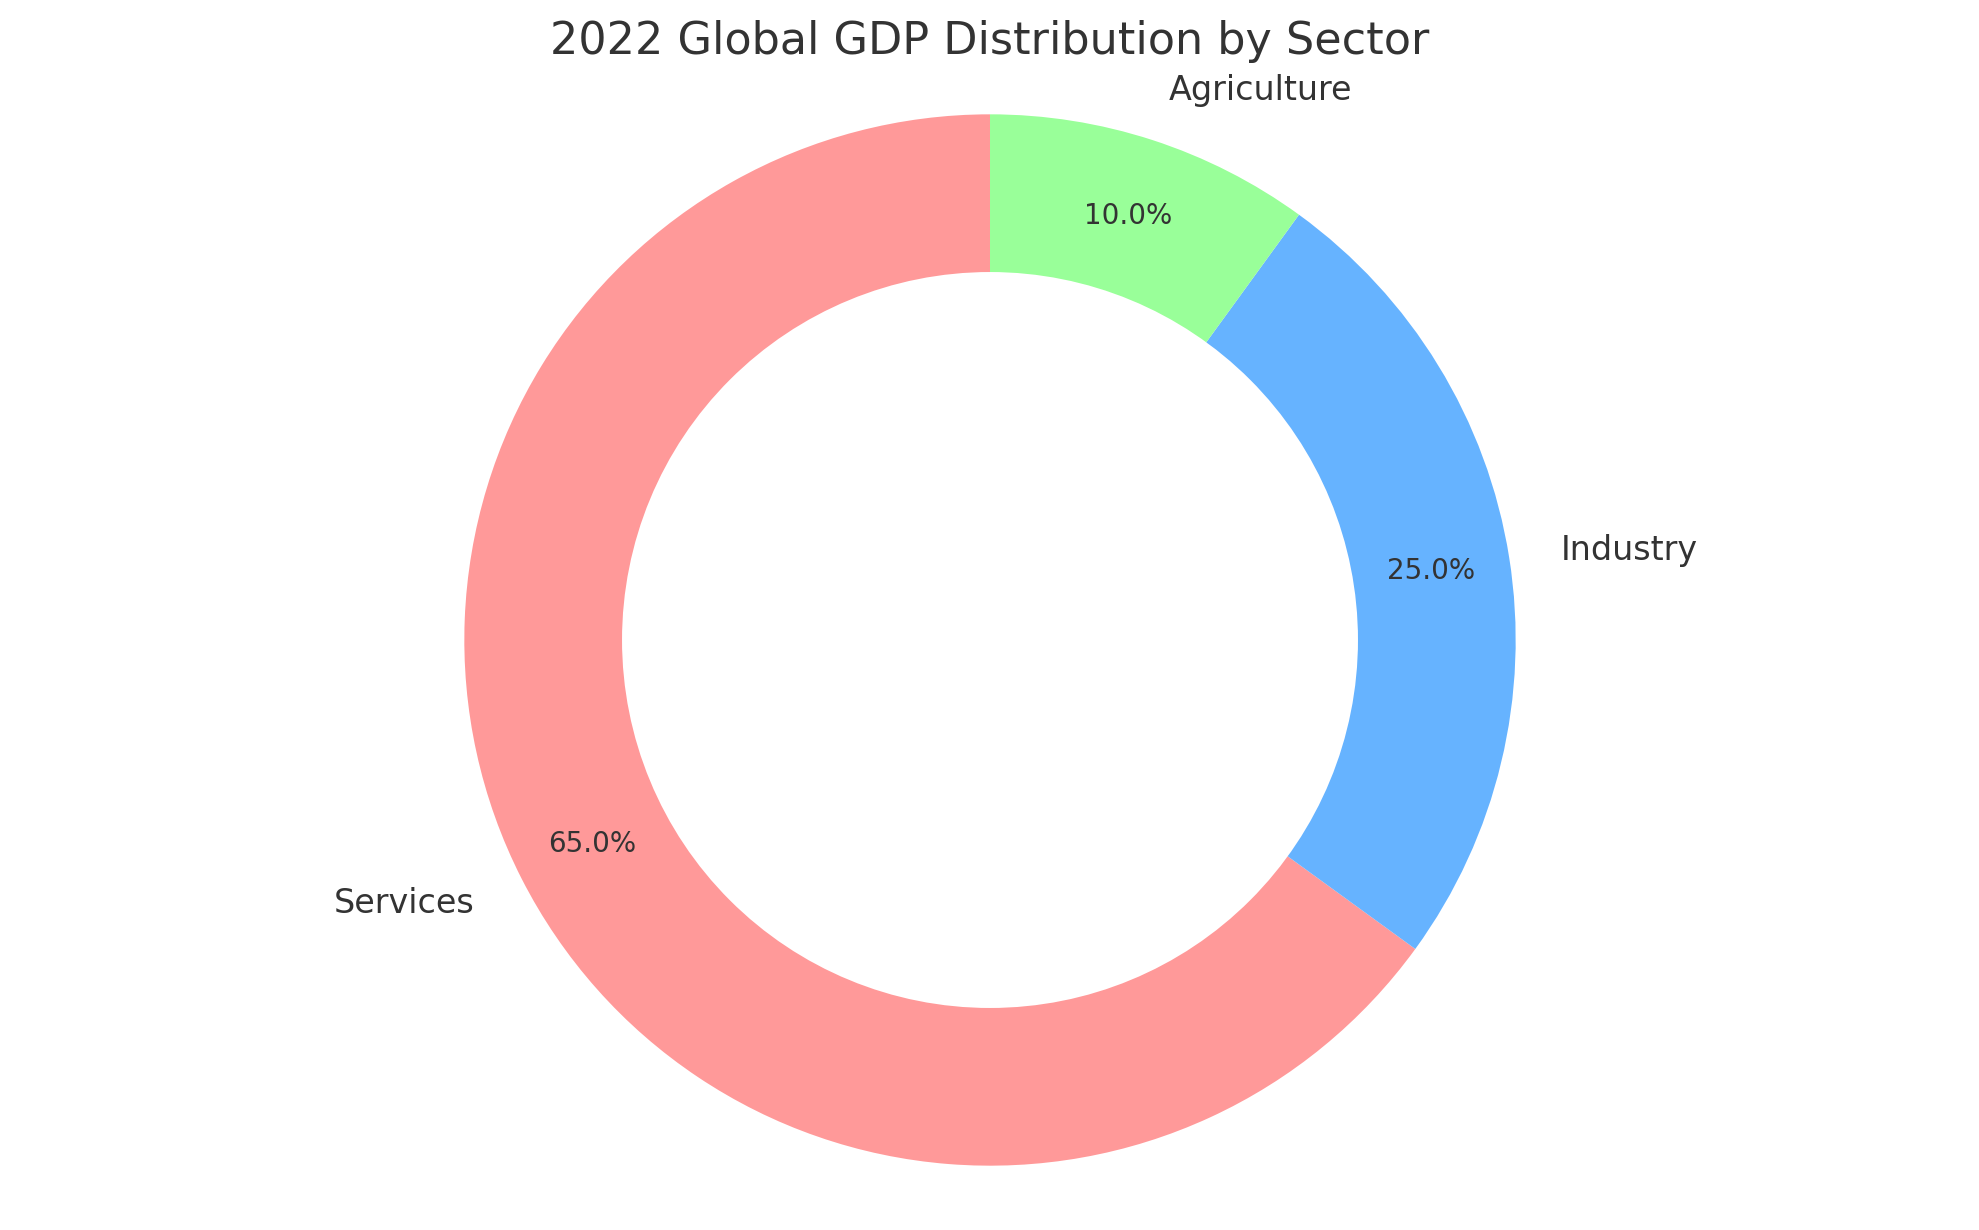
As of 2022, the global GDP or GWP was distributed among various sectors, including services, industrial and manufacturing, and agriculture.
- Services (e.g. education and banking)
- Industrial (e.g. car manufacturing)
- Agriculture (e.g. farming and crop production)
This distribution reflects the dominance of service-based economies.